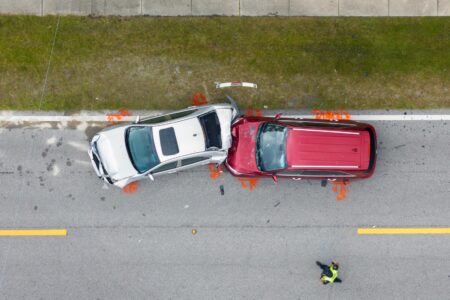
The number of people who died on American roads fell to roughly 39,800 in 2024. That marks the lowest figure since the pandemic began, and it reverses the deadly surge that started in 2020. But before you breathe a sigh of relief, here’s the catch: the rate of improvement is slowing, and some crashes are actually getting deadlier. The drop isn’t a fluke, but it’s also not a victory lap. Let’s look at what changed, what didn’t, and what it means for your drive home tonight.
What the 2024 Data Actually Shows
The National Highway Traffic Safety Administration (NHTSA) tracks every fatal crash in the country, and their preliminary estimates for 2024 are out. The headline number is encouraging: fatalities dropped about 3% compared to 2023, landing near the 39,800 mark. That’s a meaningful improvement, especially since 2021 and 2022 saw some of the highest death tolls in over a decade.
Dig deeper, though, and the picture gets less rosy. The 3% decline is a much smaller drop than the 3.6% fall seen in 2023, which itself was smaller than the 2% decline before that. The trend line is still pointing down, but the slope is flattening. We’re not returning to the steady year-over-year declines we saw in the 2010s. The gains are getting harder to come by.
Here’s another wrinkle. Even with the decline, 2024’s numbers sit above 2019 levels. That means we’ve recovered from the worst of the pandemic spike, but we haven’t gotten back to baseline. The roads are effectively deadlier than they were five years ago, even if the raw totals look better on paper.
Why Fatalities Spiked and Then Fell
You can’t understand the 2024 drop without understanding the 2020 surge. When the pandemic emptied highways, the drivers who remained got reckless. With fewer cars on the road, speeds rose, and empty streets invited aggressive driving. The result was a paradox: fewer miles driven, but more deaths per mile traveled.
That fatality rate, deaths per 100 million vehicle miles traveled, spiked to 1.34 in 2021, the highest in over a decade. What’s driving the decline since then isn’t a sudden change in driver behavior. It’s a mix of factors, including returning traffic volumes, enforcement campaigns, and vehicle safety improvements that finally started to catch up.
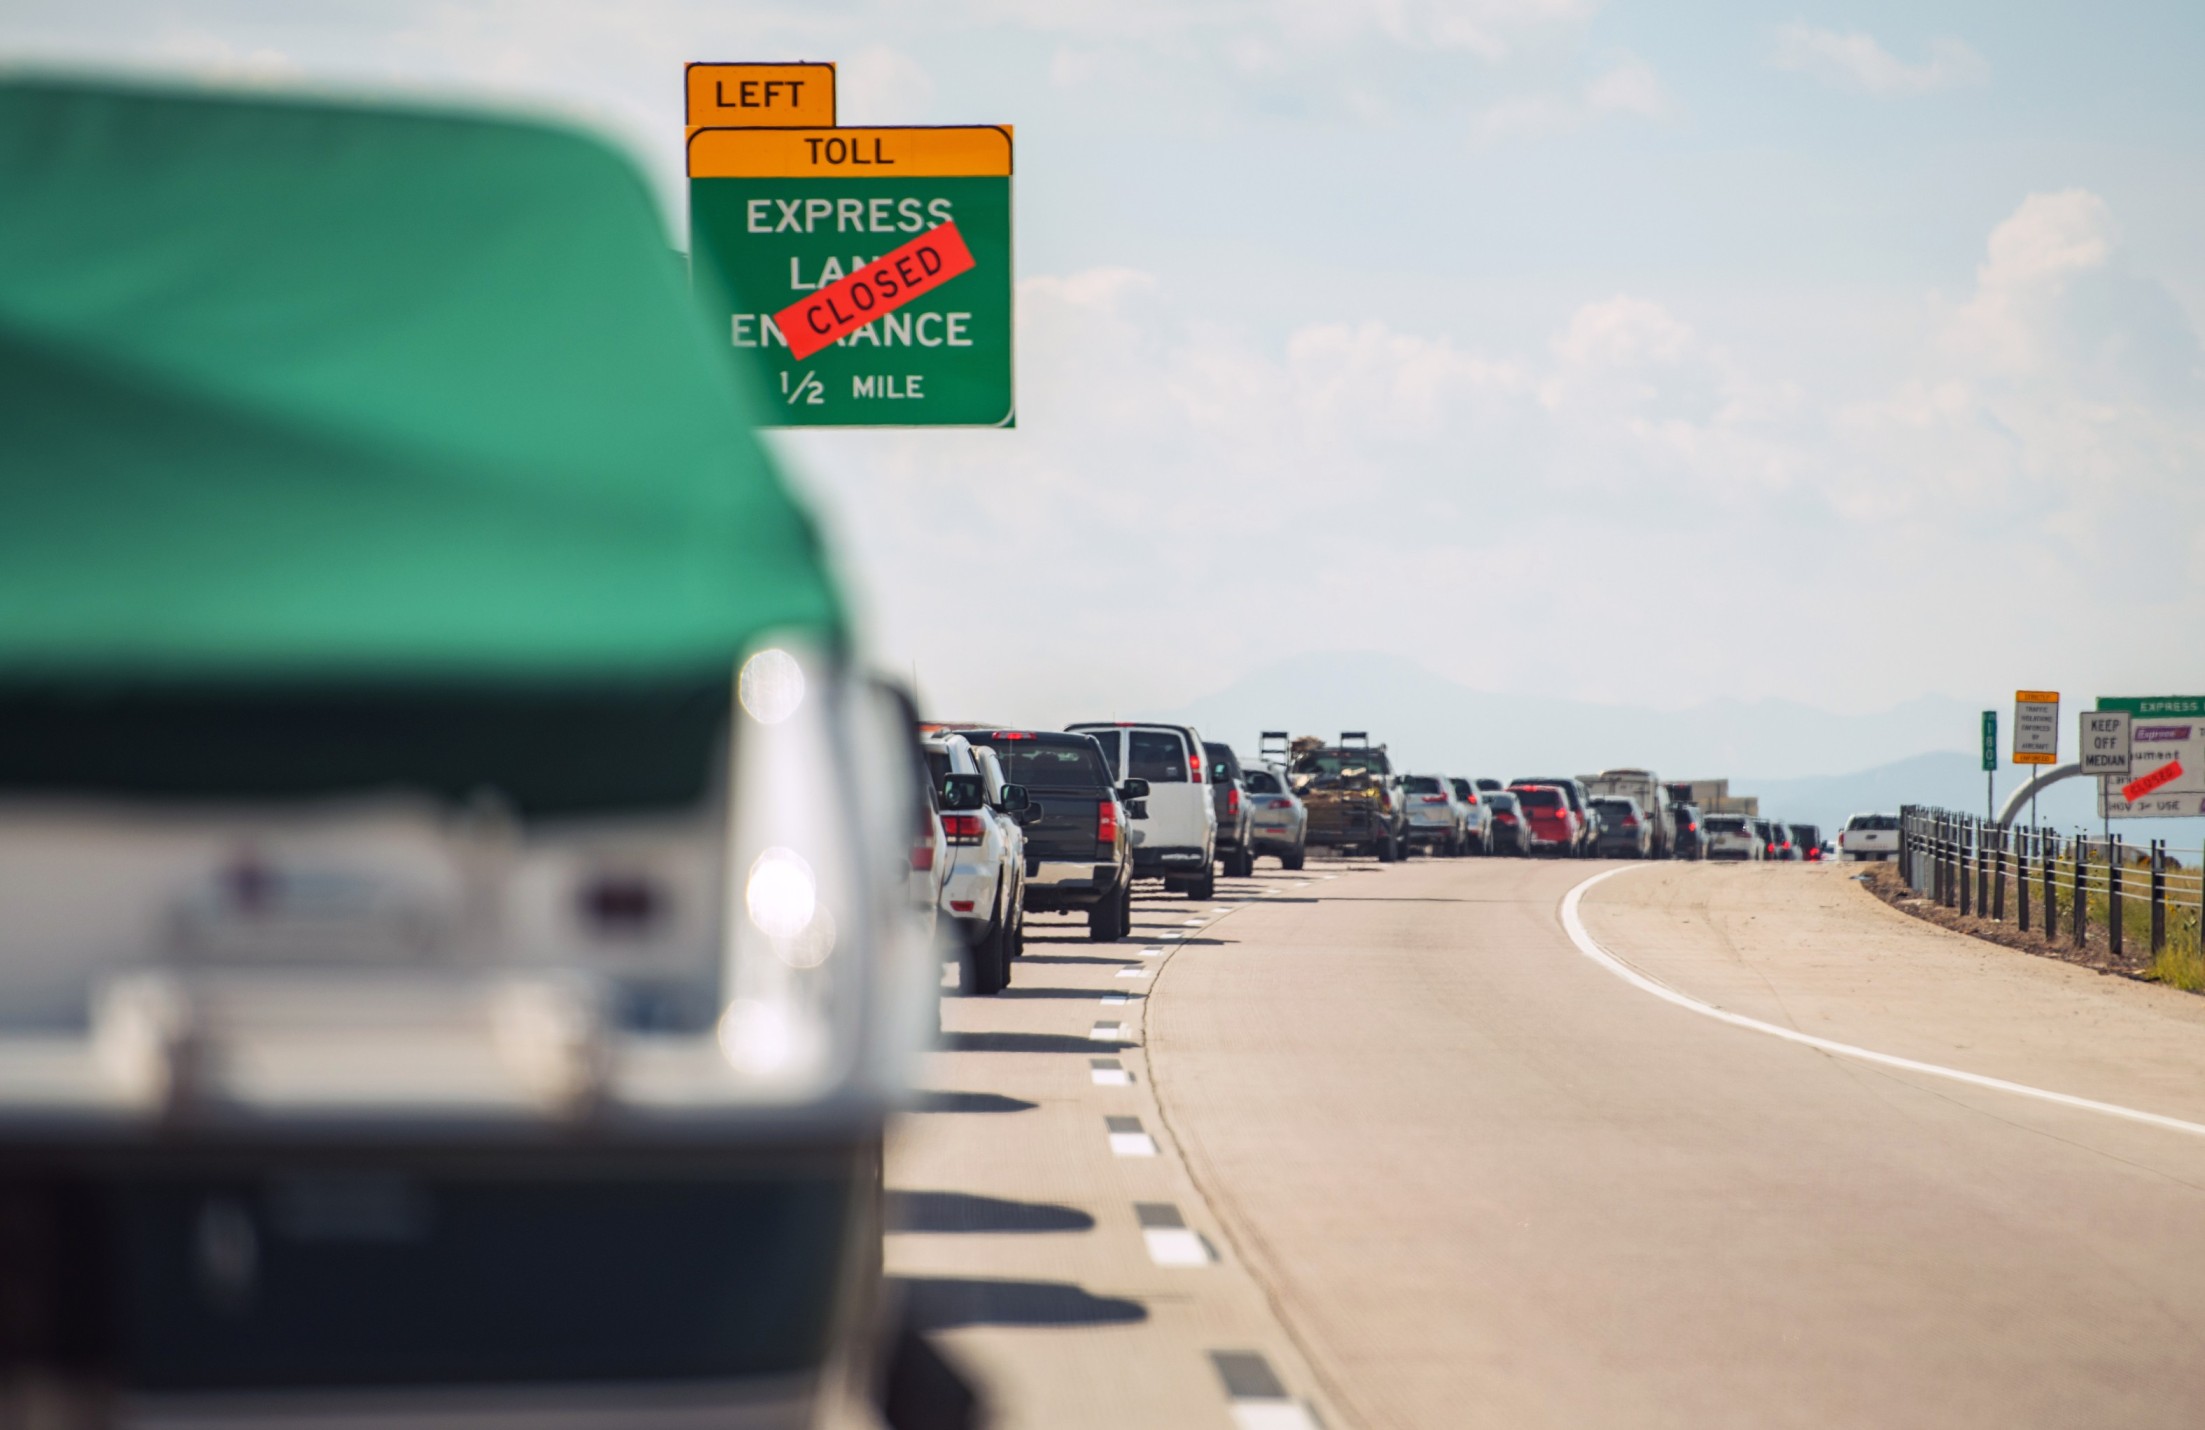
There’s also a simpler explanation at play: the roads got busier again. When traffic density returns to normal, average speeds drop, and the extreme speeding that defined 2020 and 2021 becomes physically impossible on congested highways. It’s not that drivers suddenly got better. They just got stuck in traffic again.
But here’s the uncomfortable part. The National Safety Council’s analysis of motor vehicle deaths shows that the decline is slower than the rebound was fast. The spike happened in a year. The recovery is taking several, and we’re still not all the way back.
The Troubling Trends That Aren’t Improving
While the overall numbers fell, specific categories of deaths didn’t budge. Pedestrian fatalities, which hit a 40-year high in 2022, remained stubbornly elevated through 2024. Motorcyclist deaths also stayed near record highs, and they now account for about 14% of all traffic fatalities despite being only 3% of registered vehicles.
The biggest concern, though, is the speed issue. Excessive speed was a factor in roughly 28% of all fatal crashes in 2023, according to NHTSA’s final data for that year. There’s no evidence that percentage fell in 2024. The pandemic normalized a level of speeding that’s hard to unlearn.
Here’s what I mean. Before 2020, driving 85 mph on an interstate was a definite ticket. After 2020, it became something people bragged about. That cultural shift doesn’t reverse just because traffic volumes returned. It requires enforcement, education, and time. And enforcement is spotty at best in many jurisdictions.
“We’re seeing a level of risk-taking behavior on the roads that we haven’t documented in decades,” said a NHTSA spokesperson in the agency’s 2024 year-end briefing. “The decline in fatalities is welcome, but it’s not the same as progress. The underlying behaviors that drove the spike are still present.”
That quote, shared during NHTSA’s December press call, sums up the contradiction neatly. The numbers improved, but the behaviors didn’t. That’s not a recipe for continued progress. It’s a recipe for a plateau, or worse, a second spike.
What Actually Reduces Fatalities
So what’s working? Let’s break it down by what the data actually credits for the decline, and what’s still failing.
What’s Working
- Vehicle technology: Automatic emergency braking and lane departure warnings are now standard on most new cars. These systems intervene in the seconds before a crash, and they’re credited with preventing thousands of rear-end collisions annually.
- Higher seat belt use: Seat belt usage ticked up to about 92% nationally in 2024. That alone prevents thousands of fatalities every year, since unrestrained occupants are roughly 45% more likely to die in a crash.
- Targeted enforcement: Several states ran high-visibility speeding and DUI campaigns in 2024, and the data shows modest but measurable reductions in the areas where they operated.
What’s Failing
- Infrastructure: Rural roads still lack the safety features, guardrails, rumble strips, and wider shoulders, that urban highways have. Nearly half of all fatal crashes still happen on rural roads.
- Distraction: Phone use while driving hasn’t declined. NHTSA estimates distracted driving contributes to about 8% of fatal crashes, but the real number is likely higher because proving distraction after a crash is difficult.
- Recidivism: Repeat offenders drive a disproportionate share of fatal crashes. Roughly one in five drivers in fatal crashes has a prior moving violation on their record.
That last point matters more than most people realize. The data shows that a small group of high-risk drivers causes an outsized share of the carnage. Targeting that group through license suspensions and ignition interlocks has a bigger impact than mass awareness campaigns.
The Data Table: Fatalities by Year, 2019 to 2024
Here’s the raw trajectory, based on NHTSA’s final counts through 2023 and preliminary estimates for 2024. The CDC’s injury data tracking confirms the same pattern from a public health perspective.
| Year | Total Fatalities | Change from Prior Year
|
| 2019 | 36,355 | Baseline |
| 2020 | 38,824 | +6.8% |
| 2021 | 42,939 | +10.6% |
| 2022 | 42,514 | -1.0% |
| 2023 | 40,990 | -3.6% |
| 2024 (est.) | 39,800 | -2.9% |
Notice something about this table. The spike from 2020 to 2021 was a 10.6% jump, the largest single-year increase since NHTSA started collecting data. The declines since then have been single digits, every year. Mathematically, it’ll take several more years of 3% declines just to get back to 2019 levels. That’s not a recovery. That’s a slow grind.
And here’s a detail most outlets missed. The 2024 estimate of 39,800 is still higher than any year from 2008 through 2019. We’re not back to normal. We’re back to a number that was considered unacceptable a decade ago.
What You Can Do Behind the Wheel
You don’t control what other drivers do. You don’t control the road design or the enforcement levels in your county. But you do control a few things, and the data says they’re the ones that matter most.
First, slow down. The relationship between speed and fatality risk isn’t linear. A crash at 65 mph is roughly four times more likely to be fatal than a crash at 50 mph. Those extra minutes you save by speeding aren’t worth the multiplier.
Second, put the phone in the glovebox. Not in the cupholder. In the glovebox. The NHTSA distracted driving fact sheet reports that sending or reading a text takes your eyes off the road for about 5 seconds. At 55 mph, that’s the length of a football field. You don’t need to know what your group chat said that badly.
Third, defensive driving is a real skill, not a cliché. Leave a two-second following distance, scan intersections before entering them, and assume every other driver might do something irrational. That last one will serve you well, because the data suggests many of them will.
The Bottom Line
The 2024 drop is real, and it’s worth acknowledging. Thousands of families didn’t get the worst phone call of their lives because the numbers moved in the right direction. But the trend is fragile, the underlying behaviors are unchanged, and the recovery is incomplete.
The uncomfortable truth is that the biggest gains have probably already happened. The low hanging fruit, getting drivers back to something resembling sane post-pandemic behavior, is picked. The next round of reductions will require harder changes: better road design, stricter enforcement of repeat offenders, and vehicle technology that goes beyond warnings to active intervention.
If you’re facing a traffic citation right now, you’re sitting in a different position. You’re on the enforcement side of this equation, and it’s worth understanding your options. A Modesto Partition Lawyer handles a specific type of property dispute, but the lesson translates: the law is rarely as simple as the ticket makes it seem. For driving matters, knowing your rights and your options matters just as much as knowing the speed limit.
So here’s the question that matters more than the statistics. What’s your personal plan for the next time you get behind the wheel? Because the data is clear on one thing: the roads got safer in 2024 because of millions of individual decisions, not one big policy change. Your next decision is part of that number either way.